
Graphed, the correlations look like this:
Every SEO has pushed Excel beyond it’s limits at some point. Pandas (‘Python Data Analysis Library’) is a widely used Python library that can handle far more data than Excel/Google Sheets.
As an example, here is a Jupyter Notebook with Python / Pandas code that:
- Upload a .CSV export from Search Console > Performance > Queries
- Adds some data features
- Graphs the correlations
Example data from recruitin.net:
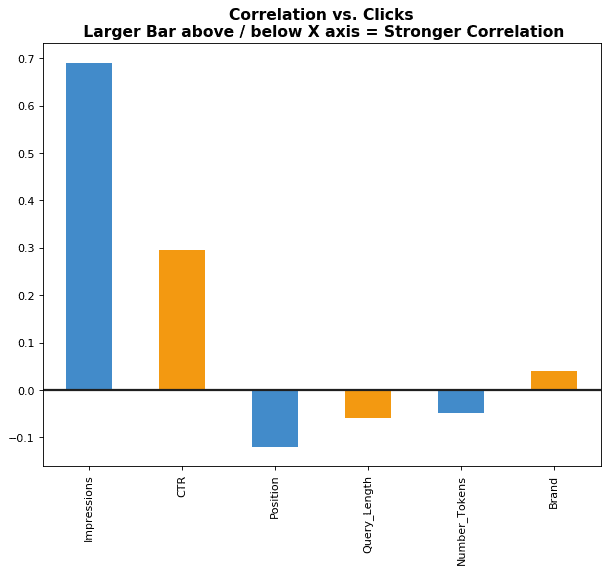 Graphed, the correlations look like this:
The notable insight from the recruitin.net data is that due to very strong rankings and a relatively unknown brand, generic terms drive more clicks than brand-terms. In this particular niche the specificity (query length & number of tokens) have a very week impact on clicks.
Feel free to download the workbook from GitHub and use on your own data as you wish.
Further reading
- Getting started with Jupyter
- Getting started with Pandas
- This excellent article on Machine learning for SEO which provided inspiration for this post
